News
- Alcohol Emergency continues as latest ONS Deaths Data Published
- AFS Welcomes Parliamentary Vote to Increase MUP
- AFS welcomes HSCSC vote in favour of increasing MUP
- New PHS Dashboard reveals true scale of alcohol harm
- Response to questions regarding AFS funding
- Alcohol related hospital admissions down but alcohol harm still too high
- Stand Firm and Save Lives
- AFS welcome Scottish Government plans to increase MUP
- Levy on supermarkets could raise £57 million a year
- Support for a Public Health Levy on alcohol sales
- First Minister commits to reduce childrens exposure to alcohol marketing
- Survey shows post-pandemic increase in drinking for some
- Scottish Government commit to further plans to restrict alcohol marketing
- Challenge and Change: Rod Anderson
- Parliament must come together to renew and reinvigorate MUP
- A responsible drinking campaign that features cocktail recipes
- Unacceptable rise in alcohol-specific deaths
- Health experts share concerns about complaint made on MUP evaluation
- Decline in alcohol treatment in Scotland
- Challenge and Change: Lived Experience Voices on Alcohol Marketing
- Blog post for Alcohol Awareness Week 2023
- Final verdict on MUP
- Alcohol and diabetes
- Doctors say lack of response on alcohol deaths could spell disaster for Scotland
- MUP reduces deaths and hospital admissions
- Alcohol hospital admissions continue to be too high
- Lessons learned from countries with marketing restrictions
- What is the effect of alcohol marketing on people with or at risk of an alcohol problem?
- ONS figures show highest alcohol deaths on record
- MUP and alcohol sales
- Scottish Government launches alcohol marketing consultation
- MUP and alcohol products and prices
- New licensing policy review guide
- Health campaigners call on Scottish Government to regulate alcohol packaging
- Scottish charity calls for ban on all alcohol promotion
- New NCD Prevention Report - Mapping Future Harm
- Online Alcohol Sales & Deliveries: A survey of young people in Scotland
- Four years of MUP
- Prominent health warnings make drinking unappealing
- Insights from People in Recovery
- Report on alcohol sales and harm in Scotland during the COVID-19 pandemic
- Sugar content in wine revealed
- Alcohol hospital admissions lower during pandemic
- Study reveals those already at risk from heavy drinking bought more alcohol during lockdowns
- Alcohol policy measures could reduce ambulance callouts
- Widespread support for calls to increase minimum unit price for alcohol to 65p
- Three quarters of Scots back new controls to help protect children from alcohol advertising
- More accurate estimates for the burden of Alcohol on the Ambulance Service: around 1 in 6 callouts in Scotland are alcohol related
- How can alcohol labels be improved to help people make informed consumption choices
- Health experts call for better alcohol labelling
- Young people and their views on alcohol marketing
- Lowest alcohol sales in Scotland for 26 years
- Minimum unit pricing has lasting impact study shows
- Euros renews call for action to protect children from alcohol sports sponsorship
- Current alcohol labelling of little relevance to young adult drinkers
- Governments should step up efforts to tackle harmful alcohol consumption
- Scottish public and leading health experts back changes to alcohol labelling
- AFS calls for 65p minimum unit price for alcohol
- How will the main parties prevent harm from alcohol?
- Alcohol labelling reform is way past its sell by date
- Alcohol policy priorities for the next parliament
- Young drinkers believe prominent health warnings on alcohol could boost risk awareness
- Alcohol sales and consumption in Scotland during the pandemic
- How can we prevent alcohol deaths?
- Alcohol Deaths and Minimum Unit Pricing
- YoungScot Health Panel report on alcohol marketing and harm
- Young Scots show support for restrictions on alcohol marketing
- Better alcohol labelling - A way to boost awareness of the risk between alcohol and cancer?
- Alcohol Deaths Prevention Support
- Almost half of Scots in favour of minimum unit pricing
- Health experts campaign for better understanding of Fetal Alcohol Spectrum Disorder
- Health experts call for alcohol labelling overhaul
- Australian ministers agree to visible pregnancy warning
- Alcohol Focus Scotland welcomes new WHO report on alcohol pricing
- Survey shows Scots lockdown drinking rise caused by stress
- Statistical analysis of off-trade alcohol sales in the year following MUP
- Alcohol Focus Scotland Review of statements of licensing policy 2018 to 2023
- We need to continue long-term focus on alcohol
- Scots report changing drinking patterns during coronavirus lockdown
- Time to Blow the Whistle on Alcohol Sport Sponsorship
- New evidence demonstrates that alcohol ads lead to youth drinking
- Alcohol sales fall in first year of MUP
- First study published into under 18 drinkers post MUP
- Two years on Are annual functions reports reaching their potential?
- Scottish primary children call for action on alcohol
- Its time to tell us whats in our drinks
- A home for Rory
- Alcohol sales and MUP
- Lowest alcohol sales in 25 years
- The Children's Parliament investigates an alcohol-free childhood
- Minimum unit pricing one year on
- More about sales data
- A family of resources it is all about prevention, education and resilience
- AFS publish Review of Licensing Board Annual Functions Reports 2017-2018
- Marketing unmasked dispelling the myths and taking a stand
- No place for alcohol marketing in sport
- Scotland publishes first UK guidelines for diagnosing fetal alcohol spectrum disorder (FASD)
- The Alcohol Framework 2018 Preventing Harm
- Scotlands new drug and alcohol strategy launched
- AFS welcome new alcohol strategy
- Recent reporting on alcohol sales data
- Diageo is failing to provide latest guidelines on their products
- Drinks companies keeping consumers in dark about risky drinking
- Reducing alcohol consumption can address health inequalities
- Global first alcohol policy set to save hundreds of Scots' lives
- AFS welcomes minimum unit pricing for alcohol
- Truer picture of alcohol harm revealed
- Alcohol causes 3,700 deaths in Scotland every year
- Scotland's licensing system needs clearer direction
- Minimum pricing blog
- Minimum pricing gets green light
- Alcohol brands and young people
- Time for honest conversations about alcohol
- Q&A on alcohol marketing
- UK children anxious about parents' drinking
- Alcohol producers failing to inform public
- Concern over alcohol-related deaths
- We need to make it easier for people to drink less
- Worrying rise in alcohol-related deaths
- Minimum pricing will save lives
- Pocket money prices for alcohol continue
- Scotland's alcohol problem laid bare
- One drink a day can increase breast cancer risk
- Poverty linked to increased harm from alcohol
- SWA urged to respect minimum pricing decision
- Alcohol-free childhood is healthiest option
- SWA granted leave to appeal minimum pricing
- SWA will appeal to UK Supreme Court
- Minimum pricing can be implemented in Scotland
- Emergency services face shocking levels of alcohol abuse
- Every child has the right to grow up safe from alcohol harm
- Minimum pricing - European court ruling
Alcohol Deaths and Minimum Unit Pricing
By Colin Angus, University of Sheffield (Twitter: @VictimOfMaths)
Yesterday the National Records for Scotland published data on alcohol-specific deaths in Scotland in 2019. These figures are of interest to anyone looking to prevent alcohol deaths. One of the most significant policies which has been put in place at a national level in Scotland to help reduce deaths and improve health is Minimum Unit Price. We asked Colin Angus, from the University of Sheffield team which developed the model for the 50p per unit MUP in place in Scotland since 2018, to look at what the alcohol-specific death stats tell us about MUP.
Yesterday, National Records of Scotland have published new data which tells us, for the first time, how many alcohol-specific deaths there were in Scotland in 2019. This is an important number for several reason, not least because levels of mortality attributable to alcohol in Scotland are among the highest in the world – the age-standardised rate of alcohol-specific deaths in 2018 was almost double the rate in England, for example. This number has fallen by around a third from its peak in the early 2000s, but this fall stopped in 2012 and alcohol-specific deaths have been rising gradually since then.
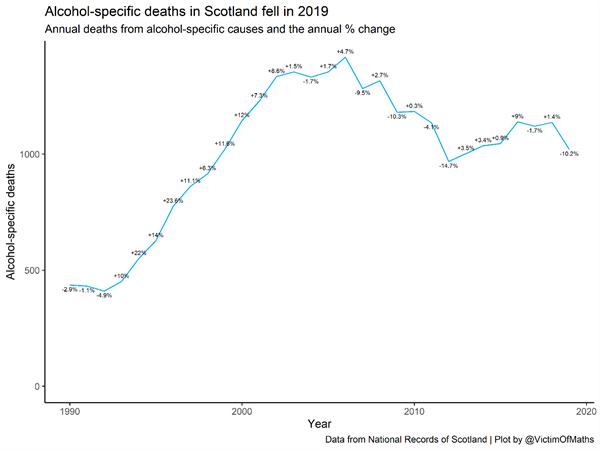
The second reason that these numbers are important and have attracted media attention is that they represent the first full year of data which is available since Scotland introduced its landmark Minimum Unit Pricing (MUP) legislation in May 2018. Modelling work undertaken by me and my colleagues at the University of Sheffield back in 2016 estimated that a 50p MUP would save 121 deaths each year. Yesterday’s publication shows us that there were 116 fewer alcohol-specific deaths in Scotland in 2019 compared to 2018, and 100 fewer than in 2017, before MUP had been introduced.
So, does that mean that my colleagues and I were right? Does this data prove that MUP is working? Should you all be asking me for the lottery numbers now? In this blog I’m going to go through the new statistics, what they do and don’t tell us, and what this might mean for the success or failure of MUP.
Alcohol-specific vs alcohol related conditions
The first thing to clarify is what exactly today’s numbers represent. Alcohol is a risk factor for a huge range of health conditions, from liver disease and alcohol poisoning to cardiovascular disease and numerous forms of cancer. For some of these conditions, alcohol is the only cause – you cannot get alcoholic liver disease if you don’t drink alcohol – while for others, excessive alcohol consumption serves to increase a risk which is already there – any of us could develop oral cancer, but the chances of that happening are greater for heavier drinkers.
Today’s figures reflect the number of alcohol-specific deaths in Scotland in 2019. Alcohol-specific deaths are those from conditions which are solely caused by alcohol, with around two-thirds of these coming from alcoholic liver disease. What that means is that we can be sure that all of the deaths reported today were because of alcohol.
But it also means that this is a significant underestimate of the total number of deaths in Scotland which were caused by alcohol, since it does not include deaths from conditions where alcohol is one of several risk factors. The most recent evidence from the Global Burden of Disease study estimates that there were a total of 3,177 deaths in Scotland caused by alcohol in 2019.
What this means is that while today’s figures are shocking in their own right, they only reflect around 1/3 of the true mortality burden of alcohol. This means that alcohol-specific deaths are a very useful indicator, but they are a long way from giving us the full picture about the harms of alcohol. All of our modelling work on MUP and our estimates on the number of lives it would be expected to save were based on this wider definition of mortality capturing all deaths caused by alcohol, not purely those categorised as alcohol-specific. So our estimate that MUP would save 121 lives each year was based on a considerably larger estimate of the number of deaths caused by alcohol before MUP was introduced than the 1,000 or so alcohol-specific deaths identified in NRS’s data.
Reductions in some harms take time. Often years.
A second key point is that the clinical evidence tells us that while reducing your alcohol consumption is likely to be beneficial for your health, for some health conditions it can take several years for those benefits to be felt as a reduction in risk. In the most extreme case, a heavy drinker who cuts down their alcohol intake in 2019 won’t expect to see a reduction in their cancer risk for a decade, and the full benefit won’t be felt until 2039. This means that, while we would expect there to be short-term health benefits from reduced alcohol consumption (be that as a result of MUP or anything else), the full benefits will not be realised for some years. When we incorporated this clinical evidence into our modelling work, we found that we’d expect less than half of the ‘full effect’ of MUP on mortality to be seen in the first year after the policy, and two-thirds of the effect to be seen after 3 years.
Modelling isn’t the same as predicting.
The final important thing to consider when comparing today’s alcohol-specific deaths to the estimated impacts of MUP from our modelling work, is that we did not attempt to forecast what would happen. Our modelling work was an estimate of the impact of MUP all else being equal. What this means is that we estimated the impact of MUP if nothing else changed in the world.
Of course, this is a very strong assumption. Nothing ever stays the same for long. Young people’s alcohol consumption has fallen hugely in recent years, while the drinking of people in their 50s and 60s has risen sharply. These trends are likely to be an important component of the rising levels of alcohol-related harm, but are not considered in our modelling. The implication of this is that we need to consider the impact of these trends when assessing the impact of Minimum Unit Pricing. NHS Health Scotland’ recent study which found that MUP had led to a fall in drinking in Scotland did this by comparing changes in alcohol purchasing in Scotland since MUP was introduced to changes over the same period in England. This research established that alcohol sales in Scotland fell by 3.6% in the year after MUP was introduced, but that sales were actually 4-5% lower than we would expect them to have been without MUP.
What do the 2019 numbers tell us?
The first thing to say is that seeing a fall in alcohol-specific deaths is unequivocally a good thing, and a reduction of 10.2% is extremely promising. In fact, once you adjust for changes in the age of the population using a process called ‘age standardisation’, the fall is more like 10.9%. Our modelled estimates suggested an overall fall of 7.4% in all alcohol-related deaths, after 20 years, so these numbers suggest our modelling work may well be conservative in its effect estimates.
But before we get too carried away, let’s have a look at the details of the new data.
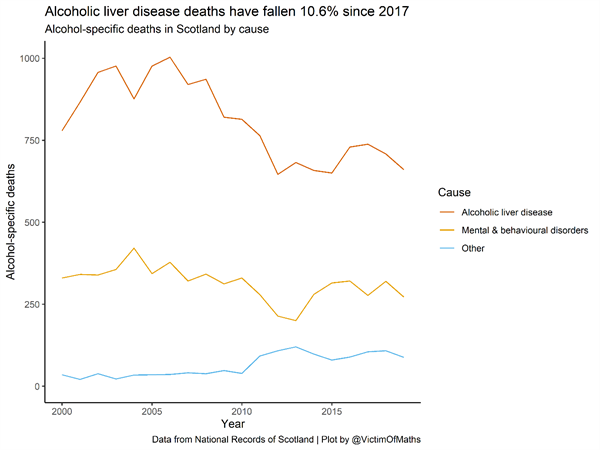
The largest contributor to alcohol-specific mortality in the UK is alcoholic liver disease. Encouragingly, deaths from this have fallen in both 2018 and 2019, while deaths from mental and behavioural disorders related to alcohol dependence are still at similar levels to 2017.
This is a similar pattern to what we saw in the recent alcohol-related hospital statistics. It is too early to tell whether this reflects some negative side-effect of MUP on dependent drinkers, random ‘noise’, or something else entirely. It’s certainly something we’ll want to keep an eye on in the next few years.
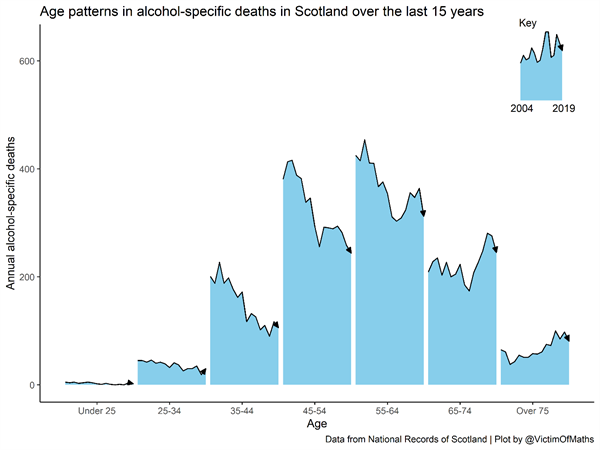
Age and mortality
If we look at how trends in alcohol-specific deaths vary with age, we can see that deaths have fallen quite sharply across ages 45-74, which are the age groups that suffer the largest harm burden from alcohol. This is what our modelling suggested – that the targeted nature of MUP means that you’d expect to see the biggest improvements in health among those groups suffering the greatest harm.
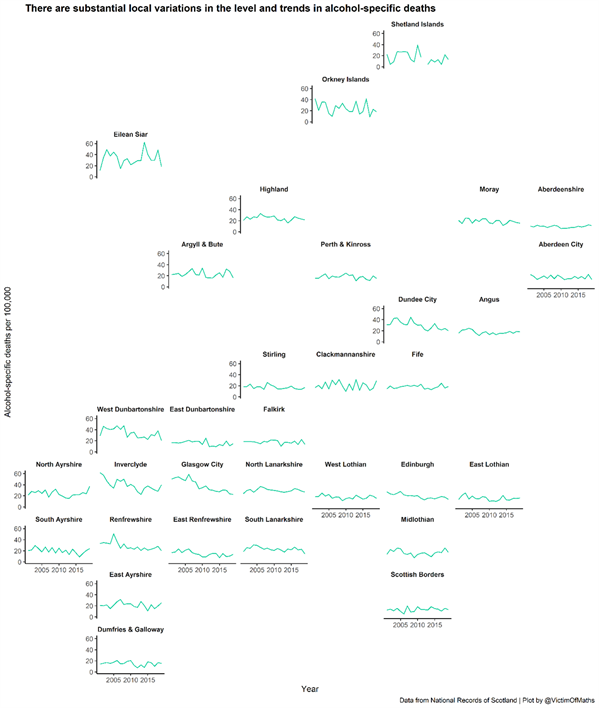
Different areas, different trends
Finally, we can look at how trends in alcohol-specific deaths vary between local authorities in Scotland. Some authorities are much bigger than others, so it makes sense to convert the numbers to rates per 100,000 population to allow us to compare them. Overall this is a much more mixed picture.
Some areas have seen a sharp downturn in alcohol-specific deaths in 2019, while others have seen an increase. We have to be careful not to over-interpret these numbers, as there is inevitably going to be more ‘noise’ when looking at smaller populations, but this suggests that we still need to be cautious about claiming these new figure as proof that MUP ‘works’.
Cautious optimism for now
Overall, I think it’s fair to say that these numbers are good news, and provide cautious optimism that the reductions in alcohol consumption we’ve seen in Scotland are beginning to be reflected in improvements in health. Indeed, if anything these numbers suggest that our modelled estimates of the impact of MUP might be on the conservative side.
However, just as we need to be careful not to dismiss evidence which goes against our expectations, so we need to be cautious about overinterpreting numbers which meet or exceed what we would have hoped.
These figures are a really encouraging sign, but they represent only a part of the overall picture, and are, by their nature, subject to some random fluctuation from year to year. The true proof that MUP has been effective will be a sustained fall in these numbers, and for that, we’re going to have to wait a little while yet.
25 November 2020.